At GitLab, we believe there's something magical about a video demo as a way to
convey strategic
vision. We've
created this video to internally align where we're going; and since we're
transparent by
default, you get to see
it as well!
So sit back, watch the video, follow
along with the
presentation,
or read below for a lightly edited transcript of the video. You can also play
with the prototype yourself (click the
header to move to the next page, click the left sidebar to move back) or
follow our progress.
Introduction
Today I’m going to talk about GitLab’s product vision for 2018. Specifically,
I’m going to show a prototype of what the product might look like.
As you can imagine with a product vision as extensive as ours, there’s a lot to
cover. So if you only remember three things from this presentation, know that:
- We’re going after the complete DevOps lifecycle, and specifically,
- we want Operations and Security to use GitLab as a primary interface, and
- a single application covering this entire scope brings emergent benefits, specifically that people can work concurrently, on the same data, with the same interface.
So hopefully it’s
obvious
by
now that we’re going
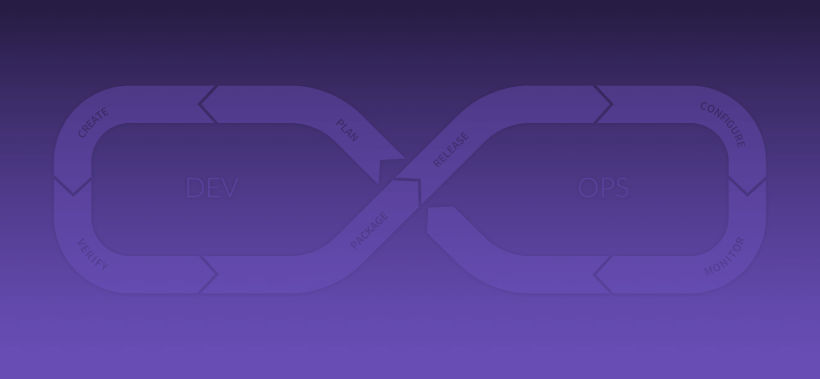
from covering the development lifecycle to covering the entire DevOps lifecycle.
 {: .shadow}
From Dev to DevOps
But traditional DevOps tools only focus on the intersection between Dev and Ops,
and GitLab is going to deliver a complete scope for both Dev and Ops. In
particular, that means we’re not just looking at how Developers can get their
code into production, but how Operations can then monitor and manage those
applications and underlying infrastructure. A big milestone for GitLab will be
when Operations people log into GitLab every day and consider it their main
interface for getting work done.
But even that’s not really sufficient, as we’re redefining what the scope of
DevOps even is; we’re also covering Security and Business needs (such as project
managers). Rather than coming up with some crazy DevSecBizOps name, we’re just
calling it DevOps, and putting it all into a single application.
 {: .shadow}
No DevSecBizOps; a single application for DevOps
And with that, each group gets an experience tailored to their needs, but shares
the same data and interface as everyone else, so collaboration is easy. Imagine
an Ops person finds an issue in production, drills down to find the application
with the problem, and sees that a recent deploy caused the problem.
Simultaneously, a dev gets alerted that their recent deploy triggered a change
in production, goes to the merge request and sees the performance change right
there. When Dev, Ops, and Security talk, they’re looking at the same data, but
from their own point of view.
Now the scope we’re going after is quite large, with a lot of new categories
being introduced this year. I won’t go into all of these today, but instead I
want to focus on a couple flows that paint a picture of how this could look.
 {: .shadow}
New product categories in 2018
Interactive prototype
For this, I’ll switch over to an interactive
prototype. [Note: if you want to try it for yourself, click the header to
move to the next page, click the left sidebar to move back.] While this may
look like a fully functioning instance of GitLab, it is just a demo and many of
these features have not been implemented yet.
Development flow
I’ll start by showing a merge request.
 {: .shadow}
Developer Flow: Merge Request
One of the new elements we see is a “Test summary” which shows a deeper
understanding of your test results. Using standard JUnit XML output, we can tell
exactly which tests fail, and provide that information in a nice summary format.
We also see links to the binary artifacts and container images associated with
this merge request.
As I scroll down, we see a lot of information about the extensive collection of
tests we’ve run on the code.
First we see the code quality section, which we’ve had for a while.
Then the relatively new Security section with static application security
testing to find vulnerabilities in your code or your code's dependencies,
dynamic application security testing to find vulnerabilities while actually
running your app, and an analysis of any vulnerabilities in any of your
underlying Docker layers.
We’ll also show how your application performance has changed.
And lastly, we’ll check your dependencies for any violations of your company’s
license policy.
Now, this is a LOT to cover for every merge request, so we have separate issues
to redesign for all this new information, but I wanted to show it all to you now
to see how much we’re doing automatically for you.
Down below all of that is an enhanced code diff that highlights any code you
should pay attention to because of code quality concerns or missing test
coverage.
 {: .shadow}
Code coverage and alerts
This is all part of the “shift left” movement, where important quality,
security, and performance tests that may have once been run manually, if at all,
and usually much later in the development lifecycle, are now being run
automatically as soon as the first code is written.
There’s a lot more planned, but this is a good idea of the direction we’re going
in to help Developers get their ideas into production faster.
Operations flow
But that only covers part of our vision, because there’s also
the Operations point of view. And a big milestone for our DevOps vision is when
Operations start using GitLab as their primary interface.
 {: .shadow}
Operations flow: operations health dashboard
There’s a long way to go, but here we’re answering the question, “How is
production doing?” In this case we’re seeing a group with four projects in it, and
a quick green/yellow/red indicator of how those projects are doing. We’ve put a
graph of the Apdex score there to represent the one-metric-to-watch.
Below the projects is a view of the cluster, including CPU and memory usage,
possibly indicating when you need to scale up or down the cluster size.
Now, if there was an indication that something was wrong, you’d be able to drill
down and see more details and rectify the situation.
But that’s only the first-level understanding of operations. I mean, if we’ve
got the data about how things are doing, why not proactively alert you to the
problem? Well, that’s the second level, and a natural step. But we’re not going
to stop there. The third level is to automatically detect and resolve any
issues. If your app needs more resources, just autoscale it. If you then hit a
limit on the cluster, well, add a node to the cluster automatically. The
Operations experience then should really just be that I go to work in the morning
and see an email summary of what has happened, without me having to do anything.
But autoscaling is just scratching the surface, as Operations involves a lot
more, from application, infrastructure, and network monitoring, to security
patches. After we’ve got this breadth as a structure, we look forward to the
customer feature requests.
Security flow
So that covers Dev and Ops, but we’ve got a lot of security
features in the product now. How about treating Security folks as first-class
citizens and giving them their own Security Audit view?
 {: .shadow}
Security flow: security audit
This is your one-stop-shop to see what security vulnerabilities have been
detected across the group, showing any automatic or manual actions taken to
address the vulnerabilities, and of course letting you click into details.
In the top left we’re reporting an overall success rate in hitting our own
internal SLAs for security vulnerabilities.
Full circle
Let’s drill down on one of these vulnerabilities.
 {: .shadow}
Automatic updates for security vulnerabilities
We see that the GitLab Bot automatically created a merge request to upgrade one
of our dependencies because it noticed that a new version was released.
Since the tests all pass, and of course the merge request fixed the
vulnerability, the merge request was automatically merged by the Bot as well.
But, to bring it full circle, l’m showing here that after merging, the CI/CD
pipeline started deploying automatically to Production. I mean, why leave a
known, fixable security vulnerability live any longer than it needs to, right?
But, in this case, even though all tests passed, we still saw the error rate
jump to more than five percent, so we automatically stopped the rollout process, and
actually rolled back to the last-known good version immediately.
Then, the Bot detects this and automatically reverts the merge request so we can
leave master in a good state.
Phew.
Summary
So, wrapping it up:
- We’re going after the complete DevOps lifecycle,
- we want Operations and Security to be our new favorite users, and
- we want teams working concurrently.
And that’s the GitLab Product Vision for 2018!